Latest Insights
Stay ahead with our latest blog posts, where we share valuable industry insights, practical tips, and inspiring stories to help you navigate the world of technology, digital solutions, and more. Dive in and discover how we can help you grow, innovate, and succeed.

- home Blog

 Admin
Admin Legal website development is no longer a project merely for Silicon Valley firms. Every lawyer, with a beginning practice or…
 Admin
Admin In 2025, your bank branch will talk to you via a browser, and your investment advisor could be an algorithm…
 Admin
Admin Every industry must adapt to the new norms today, and the jewellery industry is no different. Customers today do not…
 Admin
Admin Travel website development in 2025 will be beyond nice pictures of different places. Modern travel websites are a technologically advanced…
 Admin
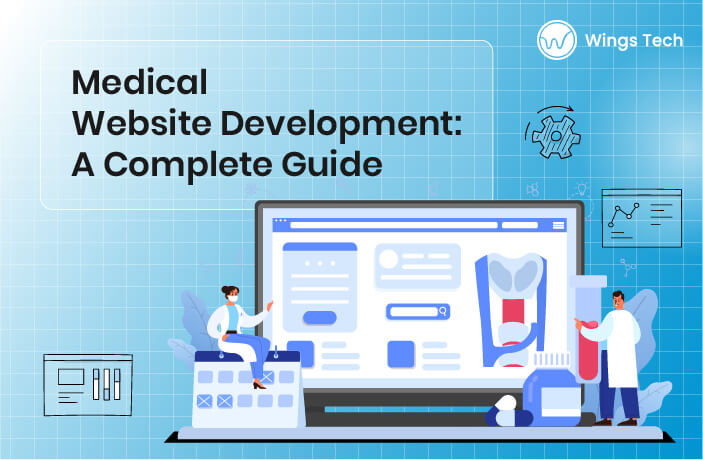
Admin A medical website development project isn’t an aesthetic endeavor, but it’s about the trust it invokes in the visitors. Patients…
 Admin
Admin There has recently been a surge in website development services, ranging from a $200 landing page to a $2000 winning…
 Admin
Admin A producer of premium goods, a supplier with orders to fulfill, and a website that’s stuck in the early 2000s—sound…
 Admin
Admin White Label Web Development Services aren’t merely a convenience, they’re an agency’s best-kept secret. You’ve got a high-profile client who…
 Admin
Admin Software development trends are on the brink of another revolution—or, as managers would rather say, “a paradigm shift.” This paradigm…
 Admin
Admin With globalization, software outsourcing has emerged as a strategic avenue for an organization to grow its business, reduce expenses, and…
 Admin
Admin The need for small businesses to stand out is similar to finding a needle in a haystack of SEO keywords.…
 Admin
Admin In the articulate expression of the distinguished entrepreneur Jack Welch, “If you don’t have a competitive advantage, don’t compete.” Software…


Winnipeg

Pawtucket

Melbourne
© 2025 Wings Tech Solutions Pvt. Ltd. All Rights Reserved.